Investor
Financial Reports
Prospectus of Public Offering
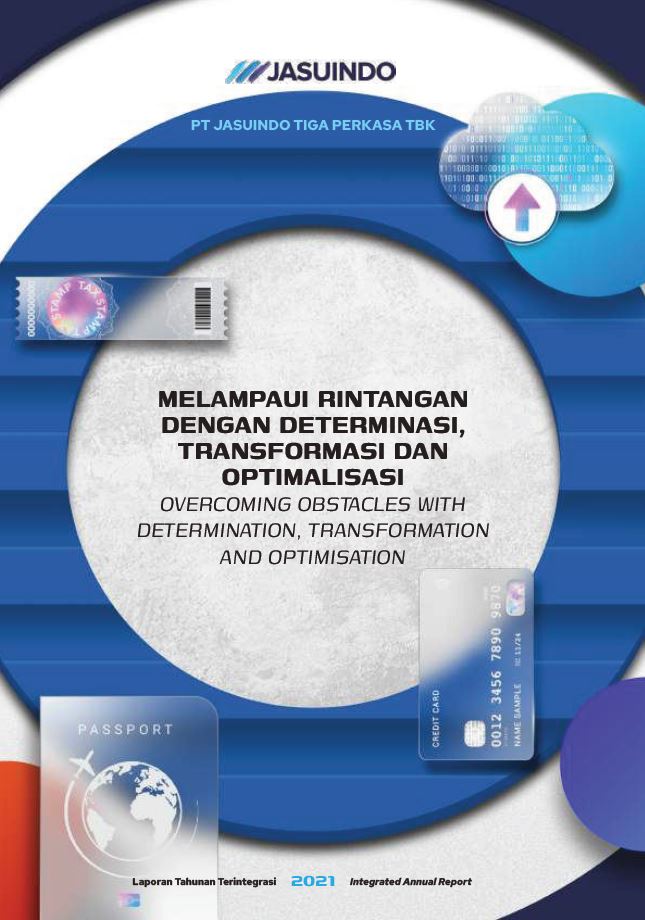
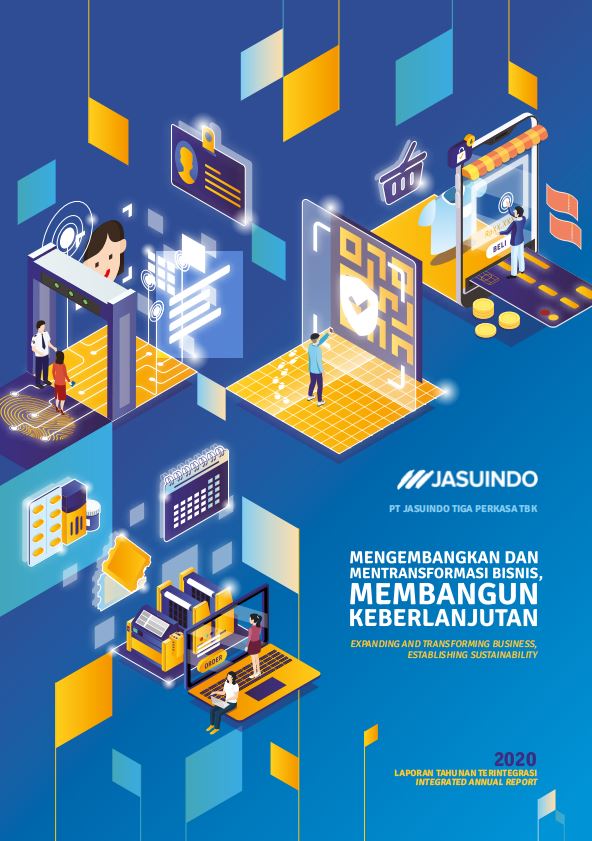
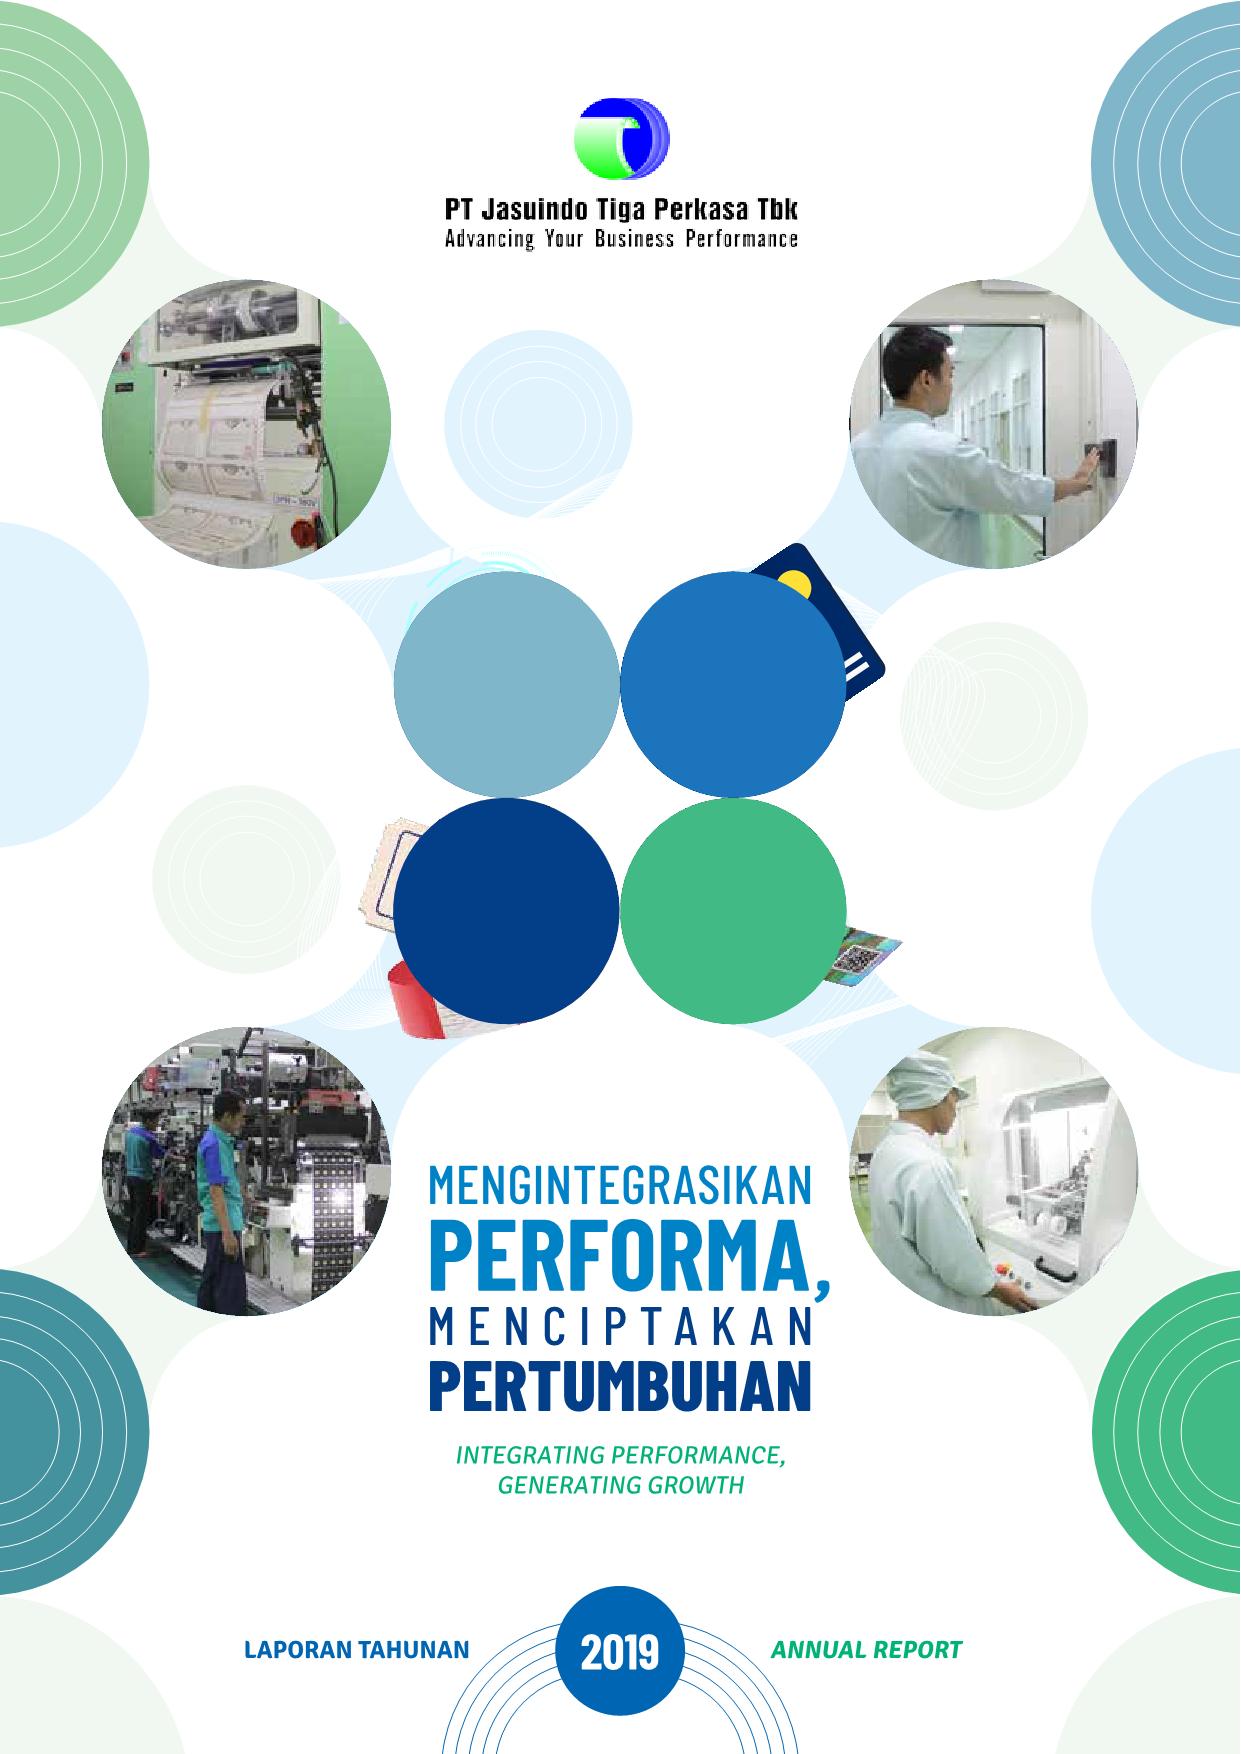
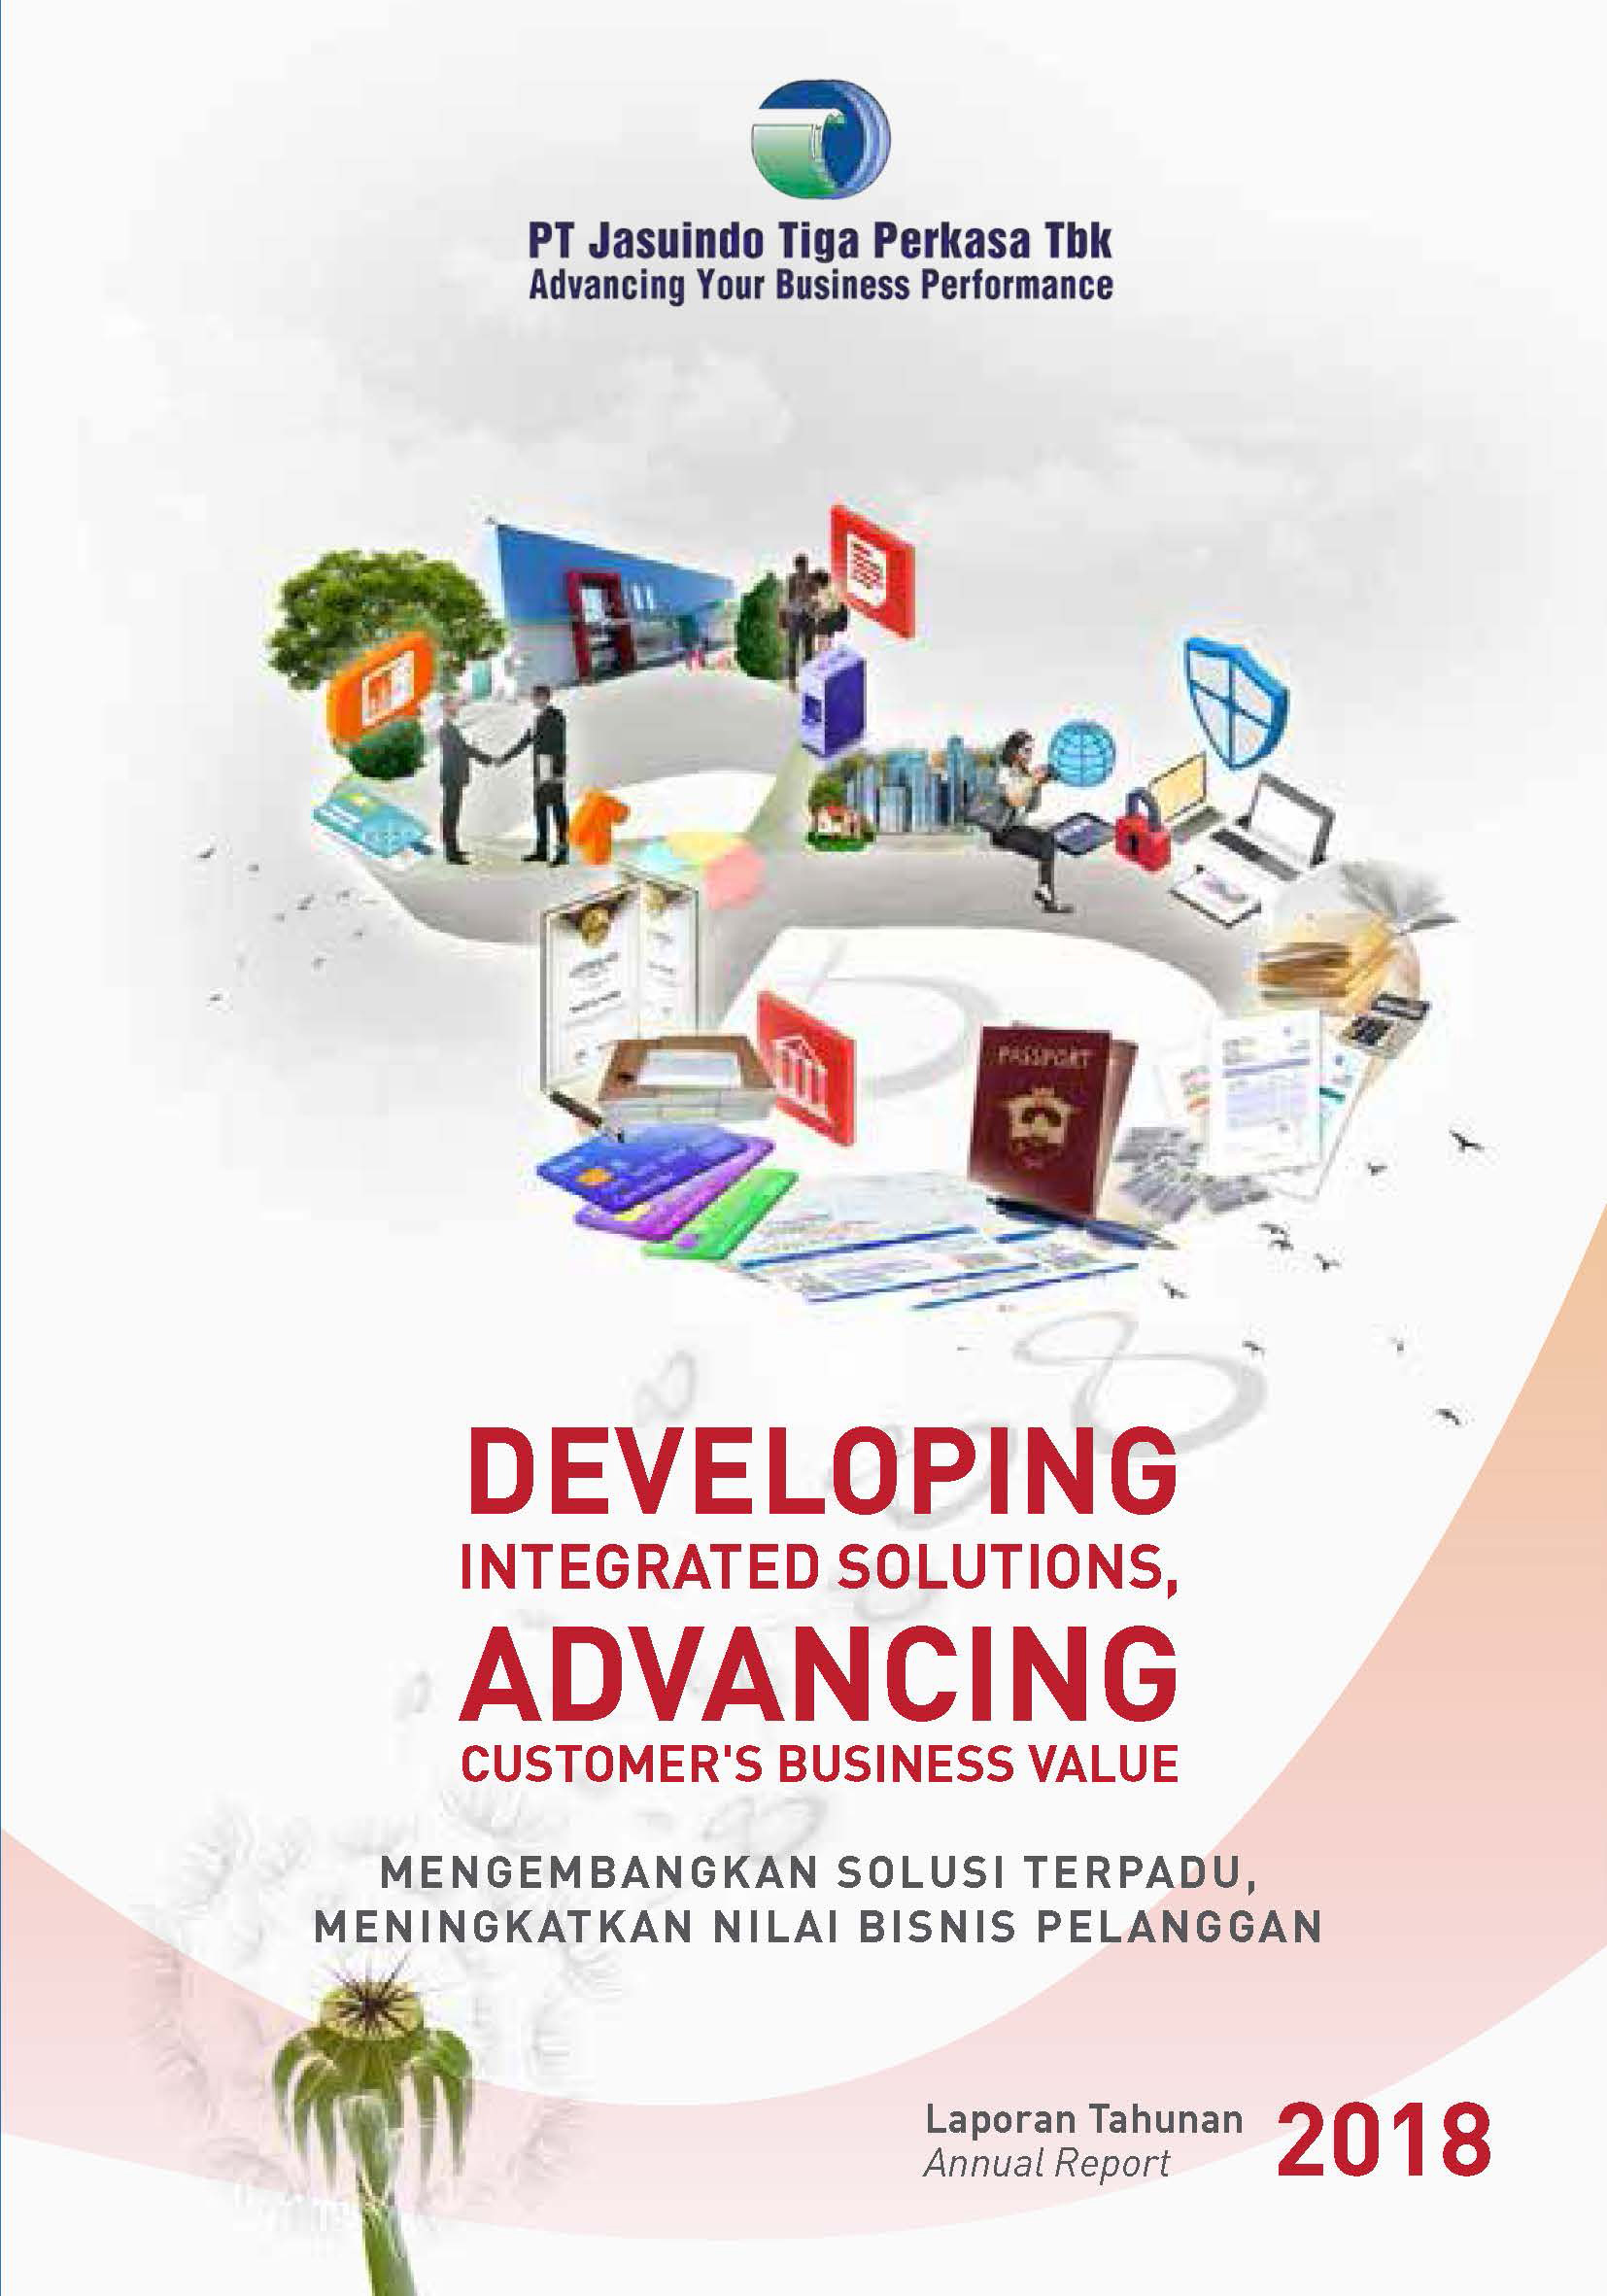
Integrated Annual Report
Quarterly Financial Report
Financial Highlight
Presented in millions Rupiah except for ratio, net-income per share and stock price
| 2023 | 2022 | 2021 | 2020 | 2019 | ||||||
| COMPREHENSIVE INCOME STATEMENT | ||||||||||
| Revenue | 2,296,272 | 1,423,143 | 1,075,949 | 978,626 | 1,438,184 | |||||
| Gross Profit | 459,513 | 326,173 | 250,931 | 219,699 | 379,791 | |||||
| Profit | 225,607 | 143.653 | 96,513 | 74,173 | 182,443 | |||||
| Profit Attributable to: | ||||||||||
| Owners of The Parent | 207,646 | 127,252 | 91,516 | 72,009 | 168,045 | |||||
| Non-Controlling Interest | 17,961 | 16.401 | 4,998 | 2,164 | 14,398 | |||||
| Comprehensive Income | 218,688 | 150.855 | 166,094 | 77,527 | 178,291 | |||||
| Comprehensive Income attributable to: | ||||||||||
| Owners of The Parent | 201,723 | 130.607 | 160,971 | 74,505 | 164,889 | |||||
| Non-Controlling Interest | 16,966 | 20.248 | 5,123 | 3,022 | 13,402 | |||||
| Net Income per share | 30.30 | 32,55 | 53.42 | 42.04 | 98.10 | |||||
| STATEMENT OF FINANCIAL POSITION | ||||||||||
| Current Assets | 1,042,773 | 843.787 | 577,891 | 507,405 | 630,300 | |||||
| Non-Current Assets | 747,001 | 719.851 | 634,698 | 530,692 | 522,396 | |||||
| Total Assets | 1,789,774 | 1.563.638 | 1,212,590 | 1,038,097 | 1,152,697 | |||||
| Current Liabilities | 654,106 | 488.176 | 242,307 | 243,966 | 377,690 | |||||
| Non-Current Liabilities | 50,549 | 53.395 | 59,444 | 23,715 | 29,177 | |||||
| Total Liabilities | 704,655 | 541.571 | 301,751 | 267,681 | 406,866 | |||||
| Equity attributable to: | ||||||||||
| Owners of The Parent | 996,925 | 949.280 | 856,359 | 721,084 | 697,969 | |||||
| Non-Controlling Interest | 88,194 | 72.786 | 54,480 | 49,332 | 47,861 | |||||
| Total Equity | 1,085,120 | 1.022.066 | 910,839 | 770,416 | 745,830 | |||||
| KEY RATIOS | ||||||||||
| Return on Total Assets Ratio | 13% | 9% | 8% | 7% | 16% | |||||
| Return on Equity Ratio | 21% | 14% | 11% | 10% | 24% | |||||
| Current Ratio | 1.59X | 1.73X | 2.35X | 2.08X | 1.67X | |||||
| Debt to Equity Ratio | 0.65X | 0.53X | 0.33X | 0.35X | 0.55X | |||||
| Debt on Total Assets Ratio | 0.39X | 0.35X | 0.25X | 0.26X | 0.35X | |||||
| Gross Profit on Net-Sales Ratio | 20% | 23% | 23% | 22% | 26% | |||||
| Net-Income on Net-Sales Ratio | 10% | 10% | 9% | 8% | 13% | |||||
| INFORMATION ON SHARE | ||||||||||
| Total Outstanding Shares | 6,852 | 6.852 | 1,713 | 1,713 | 1,713 | |||||
| Market Capitalization | 2,110,431 | 1.808.941 | 1,807,228 | 1,730,143 | 1,678,752 | |||||
| Share Price | ||||||||||
| Highest | 378 | 304 | 1,515 | 1,015 | 1,050 | |||||
| Lowest | 200 | 211 | 995 | 665 | 472 | |||||
| Closing | 308 | 264 | 1,055 | 1,010 | 980 | |||||
| Transaction Volume | 2,959 | 320 | 76 | 161 | 971 | |||||
| CORPORATE ACTION | ||||||||||
| Stock Split: | ||||||||||
| Exercise Date | – | 28 July 2022 | – | – | – | |||||
| Ratio | – | 1 : 4 | – | – | – | |||||
| Nominal Share before Stock Split | – | 20 | – | – | – | |||||
| Nominal Share after Stock Split | – | 5 | – | – | – | |||||
| Number of Shares before Stock Split | – | 1.713 | – | – | – | |||||
| Number of Shares after Stock Split | – | 6.852 | – | – | – | |||||
| CORPORATE ACTION | ||||||||||
| Cash Dividend : | ||||||||||
| Interim Dividend : | ||||||||||
| Implementation Date | 30 November 2023 | – | – | – | 08 Jan 2019 | |||||
| Ratio | 1 : 15 | – | – | – | 1 : 15 | |||||
| Total Dividend Paid | 102,780 | – | – | – | 25,695 | |||||
| Dividend Final : | ||||||||||
| Implementation Date | 3 Juli 2023 | 20 July 2022 | 23 Juli 2021 | 24 September 2020 | 27 Juni 2019 | |||||
| Ratio | 1 : 7.5 | 1 : 22 | 1 : 15 | 1 : 30 | 1 : 30 | |||||
| Total Dividend Paid | 51,390 | 37.686 | 25,695 | 51,390 | 51,390 | |||||
Financial Highlight
Presented in millions Rupiah except for ratio, net-income per share and stock price
| COMPREHENSIVE INCOME STATEMENT |
| Revenue | |
| 2018 | 1,269,759 |
| 2017 | 1,233,452 |
| 2016 | 1,115,699 |
| 2015 | 984,502 |
| 2014 | 834,027 |
| Gross Profit | |
| 2018 | 277,884 |
| 2017 | 258,959 |
| 2016 | 231,665 |
| 2015 | 197,864 |
| 2014 | 153,678 |
| Profit | |
| 2018 | 120,550 |
| 2017 | 81,951 |
| 2016 | 79,580 |
| 2015 | 65,316 |
| 2014 | 54,362 |
| Profit attributable to: | |
| Owners of The Parent | |
| 2018 | 112,250 |
| 2017 | 77,544 |
| 2016 | 77,662 |
| 2015 | 62,781 |
| 2014 | 54,193 |
|
|
|
| Non-Controlling Interest | |
| 2018 | 8,300 |
| 2017 | 4,407 |
| 2016 | 1,918 |
| 2015 | 2,534 |
| 2014 | 169 |
| Comprehensive Income | |
| 2018 | 120,911 |
| 2017 | 82,411 |
| 2016 | 226,939 |
| 2015 | 67,660 |
| 2014 | 54,246 |
| Comprehensive Income attributable to: | |
| Owners of The Parent | |
| 2018 | 111,257 |
| 2017 | 76,631 |
| 2016 | 225,289 |
| 2015 | 63,141 |
| 2014 | 53,951 |
|
|
|
| Non-Controlling Interest | |
| 2018 | 9,655 |
| 2017 | 5,780 |
| 2016 | 1,650 |
| 2015 | 4,518 |
| 2014 | 294 |
| Net Income per share | |
| 2018 | 66 |
| 2017 | 45 |
| 2016 | 45 |
| 2015 | 37 |
| 2014 | 32 |
| STATEMENT OF FINANCIAL POSITION |
| Current Assets | |
| 2018 | 571,321 |
| 2017 | 454,745 |
| 2016 | 483,536 |
| 2015 | 519,908 |
| 2014 | 401,192 |
| Non-Current Assets | |
| 2018 | 515,848 |
| 2017 | 560,526 |
| 2016 | 568,596 |
| 2015 | 366,939 |
| 2014 | 260,419 |
| Total Assets | |
| 2018 | 1,087,169 |
| 2017 | 1,015,271 |
| 2016 | 1,052,132 |
| 2015 | 886,847 |
| 2014 | 661,611 |
| Current Liabilities | |
| 2018 | 397,433 |
| 2017 | 374,336 |
| 2016 | 436,912 |
| 2015 | 461,207 |
| 2014 | 305,620 |
| Non-Current Liabilities | |
| 2018 | 42,310 |
| 2017 | 54,555 |
| 2016 | 61,573 |
| 2015 | 74,845 |
| 2014 | 67,713 |
| Total Liabilities | |
| 2018 | 439,743 |
| 2017 | 428,891 |
| 2016 | 498,486 |
| 2015 | 536,052 |
| 2014 | 373,334 |
| Equity attributable to: | |
| Owners of The Parent | |
| 2018 | 610,165 |
| 2017 | 553,725 |
| 2016 | 526,771 |
| 2015 | 325,464 |
| 2014 | 279,452 |
|
|
|
| Non-Controlling Interest | |
| 2018 | 37,260 |
| 2017 | 32,655 |
| 2016 | 26,875 |
| 2015 | 25,331 |
| 2014 | 8,825 |
| Total Equity | |
| 2018 | 647,426 |
| 2017 | 586,380 |
| 2016 | 553,646 |
| 2015 | 350,795 |
| 2014 | 288,277 |
| KEY RATIOS |
| Return on Total Assets Ratio | |
| 2018 | 15% |
| 2017 | 11% |
| 2016 | 9% |
| 2015 | 10% |
| 2014 | 8% |
| Return on Equity Ratio | |
| 2018 | 19% |
| 2017 | 14% |
| 2016 | 14% |
| 2015 | 19% |
| 2014 | 19% |
| Current Ratio | |
| 2018 | 1.44X |
| 2017 | 1.21X |
| 2016 | 1.11X |
| 2015 | 1.13X |
| 2014 | 1.31X |
| Debt to Equity Ratio | |
| 2018 | 0.68X |
| 2017 | 0.73X |
| 2016 | 0.9X |
| 2015 | 1.53X |
| 2014 | 1.30X |
| Debt on Total Assets Ratio | |
| 2018 | 0.4X |
| 2017 | 0.42X |
| 2016 | 0.47X |
| 2015 | 0.60X |
| 2014 | 0.56X |
| Gross Profit on Net-Sales Ratio | |
| 2018 | 22% |
| 2017 | 21% |
| 2016 | 21% |
| 2015 | 20% |
| 2014 | 18% |
| Net-Income on Net-Sales Ratio | |
| 2018 | 9% |
| 2017 | 7% |
| 2016 | 7% |
| 2015 | 7% |
| 2014 | 7% |
| INFORMATION ON SHARE |
| Total Outstanding Shares | |
| 2018 | 1,713 |
| 2017 | 1,713 |
| 2016 | 1,713 |
| 2015 | 1,713 |
| 2014 | 1.770 |
| Market Capitalization | |
| 2018 | 849,654 |
| 2017 | 469,365 |
| 2016 | 527,608 |
| 2015 | 397,419 |
| 2014 | 668,939 |
| Share Price: | |
| Highest | |
| 2018 | 510 |
| 2017 | 484 |
| 2016 | 320 |
| 2015 | 232 |
| 2014 | 382 |
|
|
|
| Lowest | |
| 2018 | 266 |
| 2017 | 270 |
| 2016 | 208 |
| 2015 | 222 |
| 2014 | 375 |
|
|
|
| Closing | |
| 2018 | 496 |
| 2017 | 274 |
| 2016 | 308 |
| 2015 | 232 |
| 2014 | 378 |
| Transaction Volume | |
| 2018 | 259 |
| 2017 | 155 |
| 2016 | 323 |
| 2015 | 157 |
| 2014 | 431 |
| INFORMATION ON SHARE |
| Partial Delisting: | |
| Implementation Date | |
| 2018 | – |
| 2017 | – |
| 2016 | – |
| 2015 | 28-Apr-15 |
| 2014 | – |
|
|
|
| Total Delisted Shares | |
| 2018 | – |
| 2017 | – |
| 2016 | – |
| 2015 | 57 |
| 2014 | – |
|
|
|
| Outstanding Shares: | |
| Before Partial Delisting | |
| 2018 | – |
| 2017 | – |
| 2016 | – |
| 2015 | 1,770 |
| 2014 | – |
| After Partial Delisting | |
| 2018 | – |
| 2017 | – |
| 2016 | – |
| 2015 | 1,713 |
| 2014 | – |
| Cash Dividend : | |
| Interim Dividend : | |
| Implementation Date | |
| 2018 | 15-Jan-18 |
| 2017 | – |
| 2016 | – |
| 2015 | – |
| 2014 | – |
| Ratio | |
| 2018 | 1 : 15 |
| 2017 | – |
| 2016 | – |
| 2015 | – |
| 2014 | – |
| Total Dividend Paid | |
| 2018 | 25,695 |
| 2017 | – |
| 2016 | – |
| 2015 | – |
| 2014 | – |
|
|
|
| Dividend Final : | |
| Implementation Date | |
| 2018 | 25 Juli 2018 |
| 2017 | 14 Juli 2017 |
| 2016 | 15 Juli 2016 |
| 2015 | 03 Juli 2015 |
| 2014 | 25 Juli 2014 |
| Ratio | |
| 2018 | 1 : 17 |
| 2017 | 1 : 29 |
| 2016 | 1 : 14 |
| 2015 | 1 : 10 |
| 2014 | 1 : 7 |
| Total Dividend Paid | |
| 2018 | 29,121 |
| 2017 | 49,677 |
| 2016 | 23,982 |
| 2015 | 17,130 |
| 2014 | 11,991 |
Financial Information
Stock Information
Public Company Ownership Structure
Share Ownership
Company Group and Shareholders Structure
Subsidiaries and Associated Companies
| Name | Subsidiary / Associated Company | Percentage of Ownership | Year Established | Business Line | Operation Status |
| PT Jasuindo Informatika Pratama | Subsidiary | 99.96% | 2001 | Printing, trade, services and information technology solutions | Active |
| PT Jasuindo HID Security | Subsidiary | 51% | 2013 | Printing industry specifically focusing on producing electronic passports | Active |
| PT Solusi Anak Milenial | Subsidiary | 99% | 2021 | Information and Telecommunications | Active |
| PT Solusi Identitas Global Net | Subsidiary | 99% | 2022 | Information and Telecommunications | Active |
| PT Cardsindo Tiga Perkasa | Associated Company | 45% | 2012 | Printing industry specifically focusing on producing Telecommunication SIMs and Smart Card | Active |
Subsidiaries and Associated Companies
| Name | PT Jasuindo Informatika Pratama |
|---|---|
| Subsidiary / Associated Company | Subsidiary |
| Percentage of Ownership | 99.96% |
| Year Established | 2001 |
| Business Line | Printing, trade, services and information technology solutions |
| Operation Status | Active |
| Name | PT Jasuindo HID Security |
|---|---|
| Subsidiary / Associated Company | Subsidiary |
| Percentage of Ownership | 51% |
| Year Established | 2013 |
| Business Line | Printing industry specifically focusing on producing electronic passports |
| Operation Status | Active |
| Name | PT Solusi Anak Milenial |
|---|---|
| Subsidiary / Associated Company | Subsidiary |
| Percentage of Ownership | 99% |
| Year Established | 2021 |
| Business Line | Information and Telecommunications |
| Operation Status | Active |
| Name | PT Solusi Identitas Global Net |
|---|---|
| Subsidiary / Associated Company | Subsidiary |
| Percentage of Ownership | 99% |
| Year Established | 2022 |
| Business Line | Information and Telecommunications |
| Operation Status | Active |
| Name | PT Cardsindo Tiga Perkasa |
|---|---|
| Subsidiary / Associated Company | Associated Company |
| Percentage of Ownership | 45% |
| Year Established | 2012 |
| Business Line | Printing industry specifically focusing on producing Telecommunication SIMs and Smart Card |
| Operation Status | Active |
Good Governance
Organization Structure
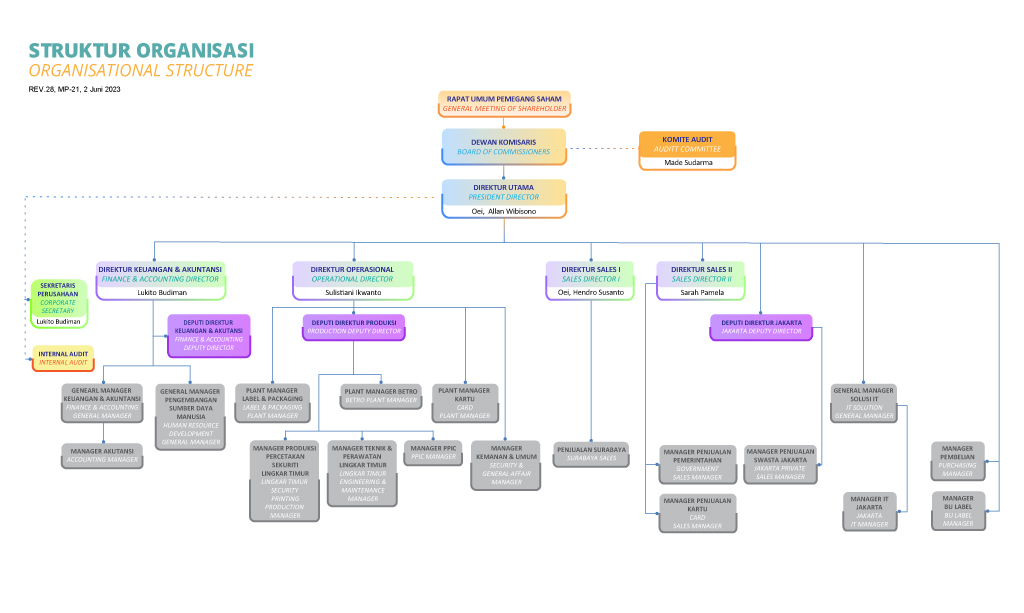
Image : Organization Structure, as of June 02nd, 2023
Management
Board of Commissioner

Yongky Wijaya
President Commissioner
An Indonesian citizen, born on 4 July 1962. Started his career as a Director in PT Iga Mulia in 1985-1990. Serving as the Company’s President Director from 1990 to 14 May 2008. Has also served as a President Commissioner on 15 May 2008, followed by a position as a Commissioner from 10 June 2010 to 17 June 2014. Serving as the Company’s President Commissioner again to the present day based on the final decree of the 2017 Annual General Meeting of Shareholders (GMS). Currently also serving as the President Commissioner in PT Urban Jakarta Propertindo. Affiliated with Oei, Melinda Poerwanto and Oei, Allan Wibisono.

PROF.DR.Made Sudarma, MM,CPA,CA.Ak
Independent Commissioner and
Chairman of The Audit Committee
Indonesian Citizen, 66 years old. Born in Singaraja on July 9th, 1957. Graduated from Masters in Financial Management in 1997 and Doctoral Program in Financial Management and Accounting in 2003, postgraduate program at Brawijaya University, Malang. Began his career in academia as a lecturer since 1982 at the University of Brawijaya Malang, an extraordinary lecturer in the faculty of economics majoring in accounting at Petra Christian University, Surabaya in 1997-2015, and became the Main Advisor for Professors class IV/e starting in 2023. Outside the academic field, became the Managing Partner of the Public Accounting Firm Drs. Made Sudarma & Partners from 1989-2005, Managing partner of KAP Made Sudarma, Thomas and Dewi since 2005, appointed as Independent Commissioner at PT Jasuindo Tiga Perkasa Tbk in 2001-2015, and became Individual Consultant for AIPD-LPPM Universitas Brawijaya Public Sector Indonesia since 2012.

Jean-Pierre Ting
Commissioner
A French citizen, born in Paris, on February 14, 1970 Graduated with a Bachelor’s Degree at Kedge Business School in 1994 and a Master of Business Administration at the University of California, Walter Haas School of Business. Started his career at the French embassy in China in 1994. In 1997 as International Sales Manager at Pechiney – Chebal Zhongshan and as Strategic Alliances Manager in 2001 at Siebel Systems. In 2003-2018 he joined ARJOWIGGINS Group SAS (now HID Group) with the last position as Managing Director. In 2019 he joined Toppan Gravity Limited as a director until now. Serves as a Commissioner of the Company based on the final decree of the 2019 Annual GMS.
Board of Director

Oei, Allan Wibisono
President Director
An Indonesian citizen, born on 10 October 1964. A graduate of the California State University of Long Beach, the United States, majoring in Computer Science and Mathematics in 1988. Started his career as the Company’s Marketing Manager in 1991-1995. Serving as a Director of the Company from 1995 to 14 May 2008, followed by a position of President Director of the Company to the present day based on the final decree of the 2017 Annual GMS. Affiliated with Yongky Wijaya and Oei, Melinda Poerwanto.

Drs. Lukito Budiman
Finance Director and
Corporate Secretary
An Indonesian citizen, born on 7 April 1960. A graduate of the Faculty of Economy of Universitas Merdeka, Malang, majoring in Accounting in 1985. Started his career as a Director in 1986-1988, a President Director in 1988-2002, and a President Commissioner 2002-2003 in PT Bank Pasar Sumber Arto Malang. Serving as a General Manager of the Company from 1999 to 14 May 2008. Then, he served as the Finance Director and concurrently as a Corporate Secretary to the present day based on the final decree of the 2017 Annual GMS.

Oei, Hendro Susanto
Marketing Director I
An Indonesian citizen, born on 23 May 1964. A graduate of Sekolah Tinggi Teknik Surabaya in 1990. Started his career as a Production Manager of the Company in 1991-1996, and as a Marketing Manager in 1996-2008. Has been serving as the Marketing Director of the Company to the present day based on the final decree of the 2017 Annual GMS.

Sarah Pamela
Marketing Director II
Indonesian citizen, born in Jakarta on May 20, 1987. Graduated with a Bachelor of Engineering at Atmajaya Catholic University of Indonesia, Jakarta in 2009. Starting his career as a marketing manager in a local company from 2008 – 2015, served as Sales Manager at a multinational company, Gemalto Pte Ltd (Thales Digital Identity and Security), then served as Business Director in multinational companies, Idemia Indonesia and Thailand. Then joined the Company in 2020 as Marketing Director based on the final decree of the 2019 Annual GMS.

Sulistiani Ikwanto
Operational Director
Indonesian citizen, born in Surabaya on April 5, 1976. Graduated from the University of Surabaya in 1997 and completed his master’s degree at the Sepuluh November Institute of Technology in 2000. Began her career at PT Central Surabaya Contact Battery in 1997 as PPIC and Export Import Staff and 2000-2003 as Production Manager. In 2003 she served as Factory Manager and in 2004 as Costing Manager at PT Kamadjaja Logistics. Joined the Company as General Manager Production in 2006. In 2009 she became Commercial Director Assistance at PT Suparma Tbk and became Commercial Senior Manager at PT Kamadjaja Logistics in 2010. She has joined the Company since 2013 until now as Operational Director and appoint as Director based on final decree of the 2019 Annual GMS.
To regulate and encourage a pattern of relationships, systems, and processes used in the company to create governance an efficient, transparent and consistent company with the applicable laws and regulations. In order to be able to achieve the sustainability of the company with its stakeholders and shareholders through good company management. Therefore, policies and regulations are made to regulate corporate governance, as well as supervision from related groups and institutions.
General Meeting of Shareholders
Risk Management Policy
The company realized that in the operations of bussiness there are some risks that must be faced. Therefore, as the company’s commitment in the implementation of good corporate governance then company assigned the management policies related to financial risk as a guide to all the employees of the company in running their work activities.
Anti Corruption Policy
The Company is committed to continue to create a healthy business climate and free from corruption. It is stated in the code of conduct regarding the policy on transactions or gratuities that are not justified according to the Law No. 8 of 2010 on the prevention and combating of money laundering and other laws and regulations.
Other Policy
Policies related to supplier selection and creditor rights
The company realizes about the significance and crucial role of suppliers in supporting the company’s business. Therefore do the selection of suppliers with an objective consideration is very important thing. Selection begins with the selection phase based on its ability to supply product in accordance with the specified by the company. The Company also conducts periodic evaluations to ensure that the purchased product has met the specified requirements. On cooperation from both sides, the fulfillment of obligations either by the supplier or buyer of goods must be met. This is important in maintaining relationships and credibility of each other.
Policies to increase the ability of vendors
The company believes that with the increasing market demand and accompanied by advances in technology led to an increasingly competitive products in both the specification and the selling price. To support it all, increasing the ability of the vendor is also a concern of the company as one part in the creation of a satisfactory result. Vendors are expected to grow together and can meet the needs of the company includes understanding each cycle, namely the provision of goods and services on the company’s operations.
Internal Audit Unit
Internal Audit Unit is a unit that established to assist the Board of Directors in carrying out supervisory role in the Company, especially in terms of providing assurance and consultations which is independent and objective, through a systematic approach, by evaluating and improving the effectiveness of risk management, control , and process of corporate governance
Audit Committee
The establishment of the company’s Audit Committee is an integral part of the company’s efforts to implement good corporate governance. In implementation of good corporate governance, the role and functions of the Audit Committee be well placed to assist and enhance the role of Commissioners to execute supervisory functions, all of that was contained in the charter of the audit committee. It is expected the roles and functions of each organ of the company (GMS, BOC and BOD) can be structured and balanced in realizing the objectives of the company.
Whistleblowing System
Submission of reporting alleged violations along with the proof can be carried out by employees of the company or third parties regarding accounting and auditing issues, allegations of fraud and corruption and violations of the code of conducts of the company to address :
Audit Committee
PT Jasuindo Tiga Perkasa, Tbk
Jl. Raya Betro No 21 Sedati
Sidoarjo 61253
or
Anti-Bribery and Corruption (ABC)
email : smap@jasuindo.com
For that report, the company guarantees the safety of employees and third parties, the complaints / reporting alleged violations. Furthermore, the audit committee will follow up on the complaint in accordance with established procedures.
Other Information
Capital Market Supporting Institutions Professions
Public Accounting Firm
Paul Hadiwinata, Hidajat Arsono, Retno Palilingan & Partners
Jalan Kebon Sirih Timur 1 No 267
Menteng, Jakarta 10340
Phone: (021) 3144003
Fax: (021_ 3144213, 3144363
Website: www.pkf.co.id
Jl. Ngagel Jaya No 90
Surabaya
Phone: (031) 5012161
Fax: (031) 5012335
Security Administrative Bureau
PT Bima Registra
Satrio Tower, 9th Floor A2 Zone
Jl. Prof. Dr. Satrio Blok C4, Kuningan, Setiabudi
Southern Jakarta 12950
Phone: (021) 2598 4818
Fax: (021) 2598 4819
Website: www.bimaregistra.co.id
Investor Information
May 06, 2024, Investor Bulletin Q1 2024
April 02, 2024, Investor Bulletin April 2024
November 15, 2023, Interim Cash Dividends for Financial Year 2023
November 01, 2023, Investor Bulletin Q3 2023
August 03, 2023, Investor Bulletin Q2 2023
July 22, 2022, Announcement of Schedule and Procedure of Stock Split
April 21, 2022 Disclosure of Information or Material Facts
November 09, 2021 Disclosure of Information or Material Facts
May 15, 2021 Additional Disclosure of Information or Material Facts
May 11, 2021 Disclosure of Information or Material Facts
July 30, 2020 Disclosure of Information or Material Facts
December 11, 2018 Interim Cash Dividens for Financial Year 2018
April 04, 2018 Disclosure of Information or Material Facts
December 20, 2017 Interim Cash Dividens for Financial Year 2017

